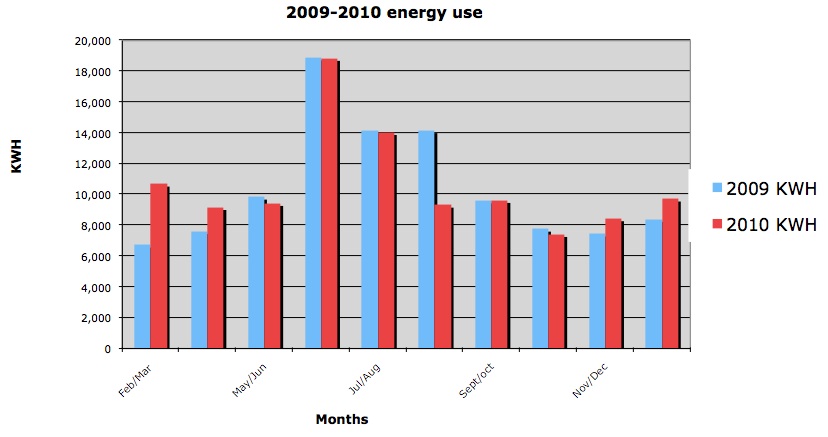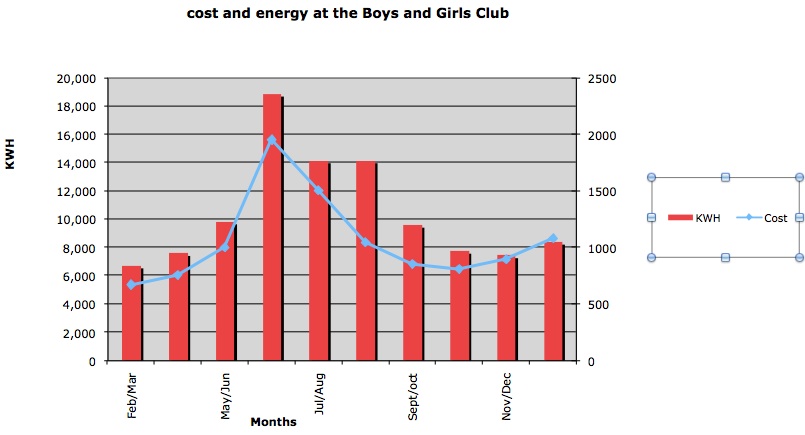
Get City used Microsoft Excel to analyze the energy efficiency of the “green roof” that was installed in Summer 2009. Using the Boys & Girls Club’s energy bills, they compared the kilowatt usage from the year 2009 to the year 2010. Below are two graphs made by Tyresha describing energy use at the Club.

You can see a big drop in energy consumption from August, 2009 to August, 2010, but consumption in some of the other months went up. We’re looking at the weather history for the past two years to try to get a better picture.

Also, It’s pretty clear from the second graph that energy consumption in watts is not exactly the same as energy cost in dollars.
